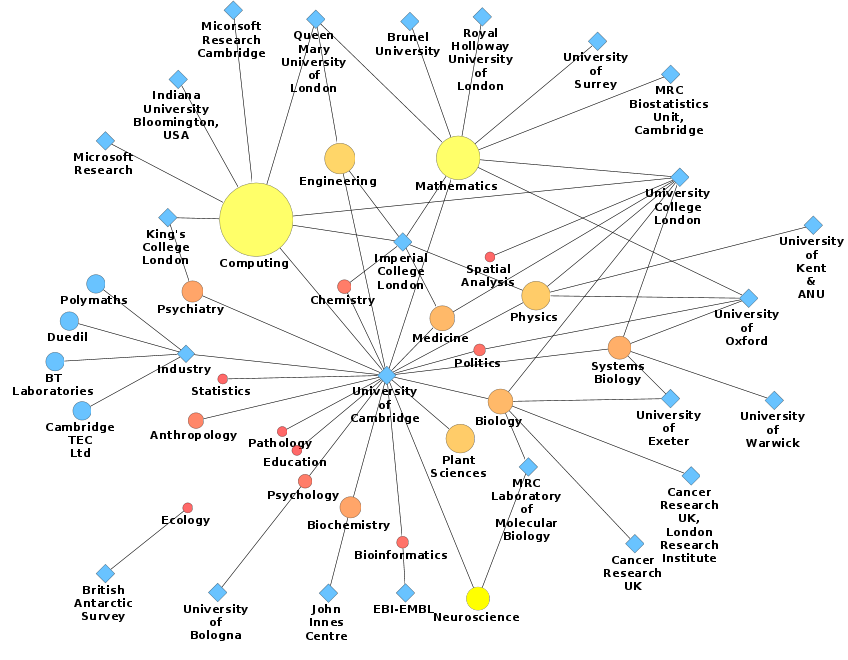
The figures below show:
1) Bipartite network of subjects and institutes: connection represent people at given institute, working in given field. Size and colour of sunject bubbles scales with number of participants in that discipline.
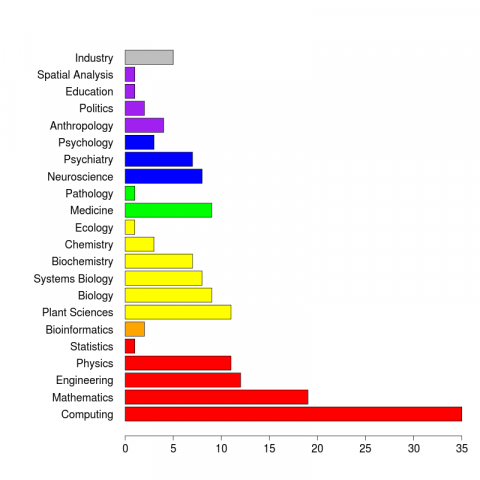
2) Bar chart of participants by subject
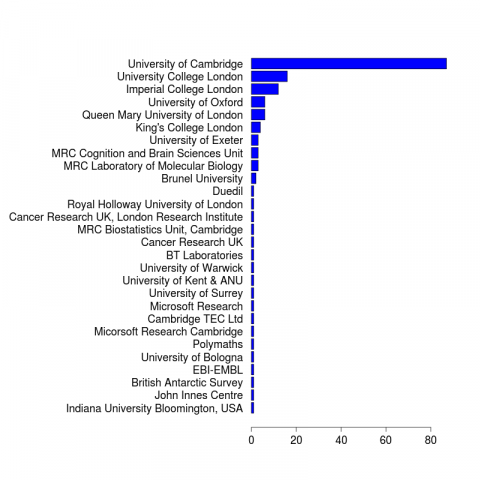
3) Bar chart of participants by institute